power point info graphic
- Status: Closed
- Prize: $30
- Entries Received: 10
- Winner: DesignerAasi
Contest Brief
Hello.
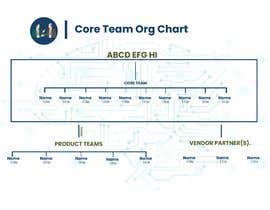
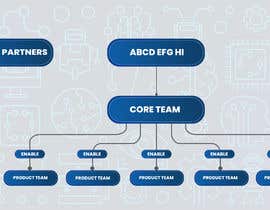
I need to show a power point info graphic that shows a data analytics machine learning theme that has:
1. Core Team Org Chart (that has 10 roles in a hierarchy format reporting upwards to two managers with a box above them all called "Core Team").
2. Core Team Org Chart (#1 above) connects multiple product team boxes (Called Product Teams ) under it (boxes should be up to 5 different product teams ) . Connector should have the word 'enable' on it: with
2. Need another box on the side of the org chart (#1 above) that says "Vendor Partner(s). Should also indicate "Learn fast and accelerate and apprentice to master learning human learning)
3. Need another box that is an input to the #1 Team Org Chart above that has ABCD EFG HI (this should be an input to box #1)
Need it to really have a machine learning team
RGB Colors we would like to use are:
Dark BLUE: 14, 64, 106
Dark GREEN: 85, 98, 43
Charcoal: 85, 87 89
Looking for an info graphic that is super fun, creative and dont forget the machine learning theme.
Recommended Skills
Employer Feedback
“Thanks for your patience and your clear clarification questions and mockups”
![]() samiadg, Canada.
samiadg, Canada.
Top entries from this contest
-
DesignerAasi Pakistan
-
DesignerAasi Pakistan
-
DesignerAasi Pakistan
-
DesignerAasi Pakistan
-
daniyalbabar9 Pakistan
-
DesignerAasi Pakistan
-
DesignerAasi Pakistan
-
DesignerAasi Pakistan
-
daniyalbabar9 Pakistan
Public Clarification Board
How to get started with contests
-

Post Your Contest Quick and easy
-

Get Tons of Entries From around the world
-

Award the best entry Download the files - Easy!


